Research Project

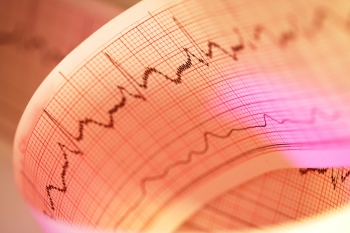
One of the factors the Federal Drug Administration (FDA) looks for when evaluating a drug is the potential for that drug to induce a cardiac arrhythmia. When a drug is administered to a patient, some of them can interfere with the normal electrical signals of the heart. In a normal heartbeat, the heart polarizes and then depolarizes, which makes the heart muscle contract then return to normal. The EKG (also known as an ECG) monitors the polarization-depolarization signal. Drugs are screened to detect whether there is any adverse effect of the depolarization of the heart. The screeners look at the termination of what is called the T-wave. The T-wave is the final visible wave in the ECG, which follows the “active phase” for what is called the QRS-complex. If the depolarization fails to complete, or if there is an over-extension of this process, the heart carries a risk of fibrillation or of potentially lethal arrhythmias.
The methodology that is currently used dates back to the 1920s method of measuring the duration of the QT interval. A strip of one to ten minutes of the EKG is looked at and a series of three “typical beats” is identified and a single measurement is made of the middle beat. The QT interval prolongation is used as a biomarker. If there is a prolongation found in the reading, then concern is raised that the drug may cause an arrhythmia. Currently, the physician is the one who decides where the end of the T wave occurs. There is not a standard measurement for this. The control subject’s heart rate also varies greatly, even when the person is in a fairly controlled environment.
NISS evaluated 12 candidate models for the QT correction based on statistical properties of the models and on data from testing at Eli Lilly. Three possible definitions (univariate measures) of treatment difference were considered: single delta, double delta and triple delta (pairwise differences, differences of pairwise differences and differences of pairwise differences of changes). The numbers of replicate ECG recordings ranged from 1 to the maximal possible. Mixed effect modeling incorporated terms for subject and treatment as well as design factors and data not only illuminated the relative impacts of the effect of design factors, but also revealed a very unexpected and critical bias typical of QT studies, i.e., systematic decrements in QTc between the first and second day of contiguous daily ECG recordings under controlled conditions
Determine key design factors to improve the information-to-cost ratio and to reduce uncertainty in thorough QT studies. Explore novel approaches to analysis of QT studies.
Stan Young, NISS; Chris M. Beasley, Jr., Eli Lilly and Charles Benson, Eli Lilly.
