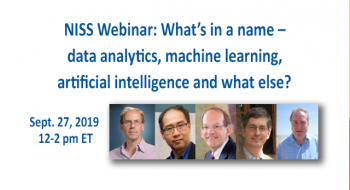
NISS brought together four distinguished and experienced speakers whose attention has lately been involved in discussions concerning the role of statistics in the 'new' field of data science. The title of the session was "What’s in a name – data analytics, machine learning, artificial intelligence and what else?"
Dan Jeske, (University of California, Riverside) opened up the webinar as a 'call to action' based on a statement released by the ASA in 2015 calling for forums involving statisticians and non-statisticians in this discussion.
Victor Lo from Fidelity Investment started the session by providing an overview of the terms that are involved in this conversation. Early researchers such as Jeff Wu and William Cleveland were mentioned along with a chronology of terms including artificial intelligence (AI), machine learning (ML), deep learning, and operations research (OR). All of these were operationalized in a Customer Relationship Management example.
Hal Stern of the University of California, Irvine also demonstrated that this topic is not new. His reference from a 1966 paper by Tukey and Wilks showed that the role of computing and statistics in data analysis is not new. He also provided evidence of the confusion that has resulted from the various terms by displaying a variety of Venn diagrams that included all of the terms discussed thus far and more. Each had their own interpretation of course! A comic moment came in the form of Hal's recapping of an early Reese's commercial as an analogy of how computing and statistics could come together in modern data analysis. "You got some chocolate in my peanut butter! You got some peanut butter on my chocolate!" Used together, they are a good combination!
Lee Wilkinson, from H2O, brought his expertise in visualization into the conversation, especially when it comes to AI and ML. Some may feel that ML can tell you everything about your data you might want to know, however, Lee provided evidence that there are many circumstances where this is simply not the case. While visualization of big data is not a easy thing to do, but there are a number of different methods or algorithms that can be applied that will assist in visualizing big sets of data. In particular, outliers, distributional, logical and model anomalies were reviewed to demonstrate his contention.
The final speaker was, Vincent Granville, (Data Science Central) who described some of the newer methodologies related to interrogating big data. This included natual language processing (NLP), taxonomy building and examples such as automated vision, recommendation engines, and the internet of things (IoT). He spent most of his time talking about the applications in his work in theoretical data science by working with number theory problems. Each of his examples were thoroughly reviewed.
Dan Jeske then opened the remaining half hour of the session sharing the questions that participants had posted throughout the session. While some were specifically directed at a speaker's example, others were more general in nature. "Which skills are more important in today's environment, statistical analysis or coding?" or "Do you think a degree in Data Science would be too shallow? That it would not be possible to meet all of the requirements needed?" were challenges that were posed to the speakers.
Please review the entire conversation by watching the video recording of this two hour session below. Also, find links below the recording to the slides that were used by each of the speakers.
Victor Lo, (Fidelity Investment) "History of evolving terms" (pdf)
Hal Stern, (University of California, Irvine) “The role of statistics in modern data analysis” (pdf)
Lee Wilkinson, (H2O) "Visualization for data science" (pdf)
Vincent Granville, (Data Science Central) “Applications of data analytics“ (pdf)
