

During the COVID-19 pandemic, epidemiologists and data scientists have relied heavily on publicly reported data about cases, hospitalizations, and deaths. However, this data does not often give the full picture of the pandemic, particularly when public health reporting systems are not always timely and complete. This fourteenth COPSS-NISS COVID-19 Data Science Webinar presents the use of a global survey, developed in consultation with the WHO, CDC, and many other international stakeholders. The survey took advantage of Facebook’s ability to reach huge segments of the population to provide a sampling frame that randomly selects daily samples. In one year, this survey reached a total of over 60 million respondents! The survey continues to collect data about symptoms, social distancing, mental health, vaccines, vaccine hesitancy, vaccine equity and more. The survey's broad reach and daily sampling permits the tracking of trends as the pandemic has progressed, and the results suggest that online surveys may have an important role to play in public health.
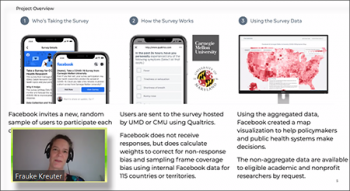
Frauke Kreuter (University of Maryland, Munich) began the presentation by providing an overview of the project, its motivation and structure. She then provided a quick walk-through of the survey instrument itself, who is taking the survey, how it works, the range of questions and then how the data is used. In addition, Frauke explained the probability weighting strategies that are used by the Facebook survey. Alex Reinhart (Carnegie Mellon University) then stepped in to discuss the methods that were used to verify the validity of the data. By comparing the data obtained through the Facebook survey to official government case reports it became clear that a high degree of agreement exists when looking at city or country level.
“This is the first time that something like this was done on a global scale and I think we all had to learn that, yes indeed, that these are valuable trends and signals that we are picking up here.”
Frauke Kreuter (University of Maryland, Munich)
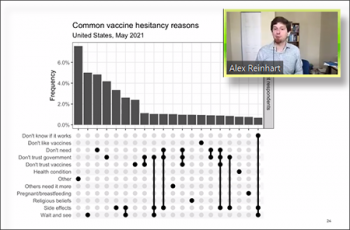
From here the focus of the session turned to the responses of the questions that targeted trends related to vaccination. Alex presented the tracking of trends both geographically, over time, by ethnic background and by gender related to vaccine acceptance. Due to the vast amount of data involved it became clear that there are many different ways to look at it, leading to a discussion of the variety of purposes one might have for designing survey questions to better understand a specific issue. For instance, Alex described a question about whether people would be more likely to get vaccinated depending on who recommends getting vaccinated. Results could then be used to determine who might be best to deliver this message. Alex walked through a number of other scenarios based on the survey data that could inform decisions makers.
Alex turned the session back over to Frauke who described how to gain access to both the publicly available aggregate data and contingency tables for both global and US survey data, as well as the non-aggregate data for research. Frauke also introduced other relevant sources of data. (Links to these resources are available in the slides found below.) To close out the session the speakers spoke about the challenges related to developing and continually engaging in a survey project of this magnitude.
Moderator Ryan Tibshirani (Carnegie Mellon) posed questions for Frauke and Alex to respond to. Questions from attendees and from Ryan himself included: “Given your results, what behavioral science or social science theories of cognition or motivation would help in convincing people deciding to get vaccinated?”, “In what ways is this survey similar to others that were given during the pandemic, and also in what ways is it different?” and “In looking back, can you comment on the biggest value that the survey has provided and will provide? And, how has the survey changed over time?”
At the end of the session both presenters invited interested attendees to become involved. It is clear that there is plenty of room for additional research!
“We really welcome and embrace anyone who wants to do analyses with the data. … We want you to take a look at the data, have an idea and run with it. Also, as things change there are ways to suggest questions to be included in future surveys. We invite all of you to participate.”
Frauke Kreuter (Maryland, Munich)“We have a huge number of groups with data usage agreements already and we would like you to be among them. It is an interesting dynamic where we have all of this data and we would like all of you to have it too! … There are a lot of research questions that could be asked and we would like all of you to study your own interests with this data.”
Alex Reinhart (Carnegie Mellon)“The opposite of the applied statistics problem. Instead of, we have all these tools, give us the data – it is exactly the opposite!”
Ryan Tibshrani (Carnegie Mellon)
Please review the recording of this session below and access the slides that Frauke and Alex used during this session.
Recording of the Session
Slides Used by the Speakers
Frauke Kreuter, (Maryland, Munich) & Alex Reinhart (Carnegie Mellon University)
About this Webinar Series
The COPSS-NISS COVID-19 Data Science webinar series is co-organized by the Committee of the Presidents of Statistical Societies (COPSS) and its five charter member societies (ASA, ENAR, IMS, SSC, and WNAR), as well as NISS. This bi-weekly seminar features the latest research that is positioned on the cusp of new understanding and analysis of COVID-19 pandemic data, and promotes data-driven research and decision making to combat COVID-19. Find out more about this series and view all the previous sessions on the Webinar Series page.
