

What do data scientists do? This tutorial featured a review of three different compelling case studies found in business today. Each of the three instructors brought to this session expertise and insight into the specific methodologies and strategies that they use to help solve the critical and unique challenges that each of their particular data science contexts present.
The Examples
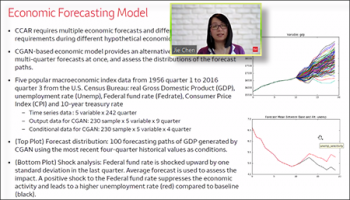
In the first segment of this tutorial featured Jie Chen (Wells Fargo) who talked about artificial intelligence and machine learning applications in banking. She provided a comprehensive overview of the methodologies and other strategies involved in credit risk models, trading models, market risk models and a variety of models using natural language processing. She then moved to four specific case examples which allowed her to get down to the specific details of how these models are implemented within various application contexts. The cases included: an auto loan loss forecast model and machine learning benchmarking, a home lending case and machine learning interpretation, a time series simulation by conditional generative adversarial net, and natural language processing applications and models as they are implemented in text classification.
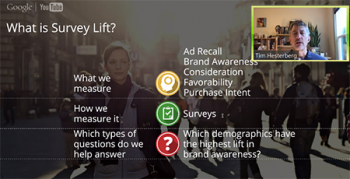
The second tutorial was led by Tim Hesterberg (Google) who walked through how Google uses surveys and big data to estimate brand lift - increased brand awareness and brand favorability from video and display ads. Unlike Search ads, they don't use clicks to measure how effective these ads are - because almost nobody clicks on them. Tim walked through a detailed explanation of lift estimation, selection and response biases and how to correct for them, and "slicing and dicing" to estimate brand lift for different age/gender groups. Tim also described a few innovations and surprises, e.g. that causal modeling regression estimates can be reinterpreted as weighting methods, similar to propensity estimates but with lower variance, and that one common approach for bootstrapping regression estimates is incorrect here.
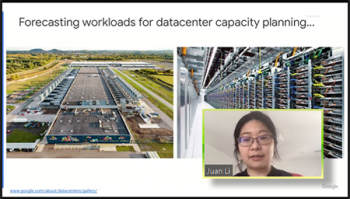
The final segment of the tutorial was also led by a data scientist at Google, Juan Li. Her focus was about supporting the infrastructure of the services Google provides by modeling capacity requirements for Google’s computing and storage resources. She started out by describing data centers as being larger than a football field, and have locations in many different parts of the world. Clearly, planning to maintain a high level of efficient service at this global scale is critical. In particular Juan’s comments described in detail the target service level that is required and why a high percentile forecast is necessary. She then described how hierarchical range forecasts are created and an evaluation framework to test how well the forecasts are performed.
Access to Materials
Once again, the Essential Data Science for Business tutorials provide so many details! Models, methods, software, examples! If you were not able to attend this live session you can still access a recording of the session. Use the Registration Option "Post Session Access" on the event webpage, pay the $35 fee, and NISS will provide you with access to all the materials for this session. Or register for the full series of ten tutorials, and NISS will provide all the links to all of sessions in the Data Science series.
What’s Up Next?
Here are the topics of the final two tutorial sessions that are coming up next:
• March 24, 2021: Sam Woolford (Bentley University) "Non-Analytic Skills for Analytic Consulting Success" (see event page!)
• May 12, 2021: Victor Lo & Dessislava Pachamanova, "Prescriptive Analytics and Optimization" (see event page!)
