

The current pandemic crisis is notable for the vast amount of traffic in official and unofficial information and claims. Who better to offer some personal insights into the challenges of trying to bring some illumination to the statistics about the pandemic than Sir David Spiegelhalter. Regularly featured on not only on major broadcast stations such as BBC and CNN, but also in publications such as The Guardian, The Sun and of course, Twitter David is not only an accomplished statistician but also quite a unique character! During this session, David not only provided advice regarding how to handle speaking with the press, he shared examples when things have gone fairly well, and some communication disasters that everyone, including himself, can learn from! (see Event page)
“We have to tell trustworthy stories from data.”
Sir David Spiegelhalter, (Cambridge University)
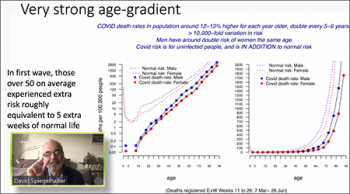
David started the session by sharing a number of fascinating examples of COVID-19 data from the UK. These examples focused on deaths within 28 days of testing positive, how the number of COVID-19 deaths were below the average number of deaths that usually occur and the lack of influenza-like illnesses. He used these examples to focus on how this information was shared with the media, then how these messages were translated and used by others in both positive ways and but also examples that were very misleading.
Using these examples and others, David showed how he was able to learn from his mistakes and even developed some checklists for how to handle responding to questions from the media. Suggestions included tips such as:
- Don’t be lured out of your comfort zone
- Beware of ‘just a chat’
- Don’t be pulled into someone else’s argument
- Steer clear of statistical jargon
- Stick to explaining
- Control the nit-picking
- Sound human
- And, you’ll get things wrong. Don’t agonize about it!
At the end of his talk David entertained us with a final example of how things can go wrong. In an interview on the UK Today Show he was discussing possible rules for the upcoming 2020 Christmas holidays. He said that raised voices could spread the virus and suggested that singing should maybe be banned? He then also joked that it also might be a good idea to ban family arguments. An hour later he saw the following in the Express, “Christmas warning: Families could be banned from ARGUING to prevent Covid spread: FAMILY rows could be banned at Christmas dinner if coronavirus lockdown rules are relaxed over the festive period, according to a leading British statistician!” You have to be ready for anything! And mind what you say!
“Data literacy is a vital skill in modern life and the COVID crisis has made this even clearer! Statisticians have shown themselves to be helpful and without strong agendas.”
Sir David Spiegelhalter, (Cambridge University)
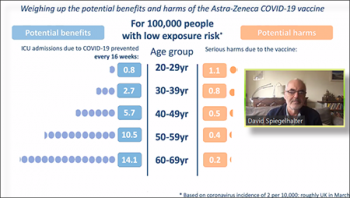
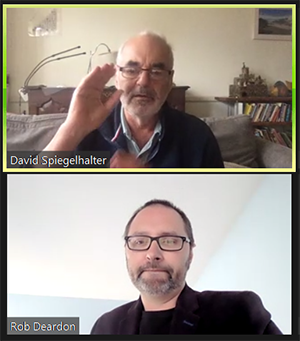
The webinar finished up by spending a good amount of time responding to questions from attendees and moderator Rob Deardon (University of Calgary) was kept busy passing these on for David to comment on. Questions were both about the communication of statistics as well as specific aspects of the data he shared. A sample of these questions included: “How does one get media training?”, “When talking to the public using about data and stats, at what level should the statistician aim?”, “Regarding the harms/benefits of Astra-Zeneca vaccine: how do the conclusions around age cut offs change based on different background incidence assumptions?” and “Can you provide advice on communicating with policy makers?” This last question to which David responded:
“I don’t make a big distinction. I would treat policy makers the same as journalists, the same as my granny were she still alive! The basic ideas are the same – trustworthy communication. You tell it like it is, you don’t try to manipulate them or push them in one way or another …you’ve got to absolutely distill the essential message and tell a vivid story. I try to get them engaged and empower them to make decisions. ”
Sir David Spiegelhalter, (Cambridge University)
Please review the recording of this session below and access the slides that David used during his talk. If you even that that you will ever be in a position to have to speak with the media, then this is not a session to miss!
Recording of the Session
Slides Used by the Speaker
Sir David Spiegelhalter, (Cambridge University)
“Communicating Statistics to the Media: Highs and Lows During the Pandemic (so far) “
About this Webinar Series
The COPSS-NISS COVID-19 Data Science webinar series is co-organized by the Committee of the Presidents of Statistical Societies (COPSS) and its five charter member societies (ASA, ENAR, IMS, SSC, and WNAR), as well as NISS. This bi-weekly seminar features the latest research that is positioned on the cusp of new understanding and analysis of COVID-19 pandemic data, and promotes data-driven research and decision making to combat COVID-19. Find out more about this series and view all the previous sessions on the Webinar Series page.
